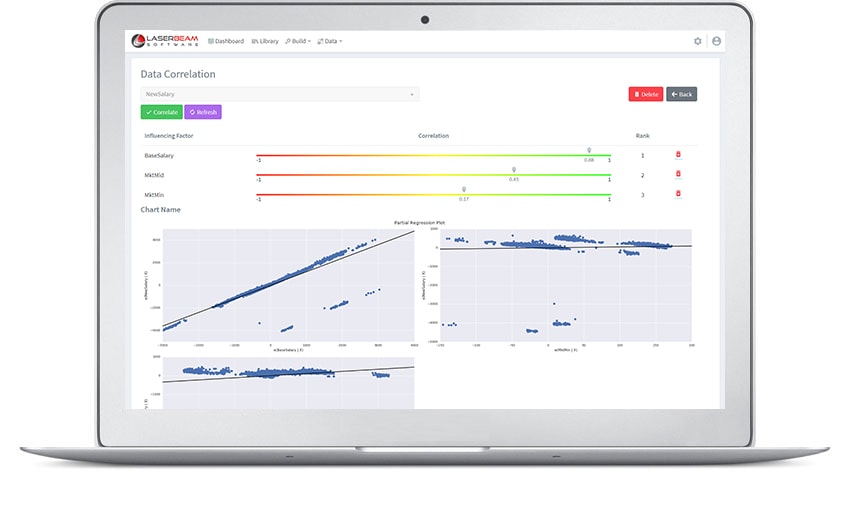
Understanding your data is key to solving data mystery, when teams start to work with the spread sheets it necessitates to understand what data is influenced by other data attributes in a data set. Let say if you want to understand what influence the New Salary, it could be based on the current employee information like salary, position, grade, market range and performance rating the correlation coefficient helps identify these factors. The clustering tool help the HR teams to remove the outliers for fine-tuning the analysis to perfections.
We have worked with customers and built few forecasting model and the list keeps growing, our models are built by statisticians by repetitive data analysis until an algorithm becomes a best fit. The team then publish a programmed model that can be repetitively run whenever there is a change in data, this automatically refreshes you forecasting and relevant charts. Some of the model readily available are
Human Resource teams in the past has been focused on delivering operational efficiency and support services to employees. This trend has however moved away, and now towards building strategic partnership with business and co-create value to departments by aligning with their heads. More and more businesses depend on the HR teams to understand how we got hear and what is in store for us if the trend continues. While understanding current state of metrics becomes an overwhelming need of the hour, it is also imperative to measure progress once corrective steps are injected into the system.
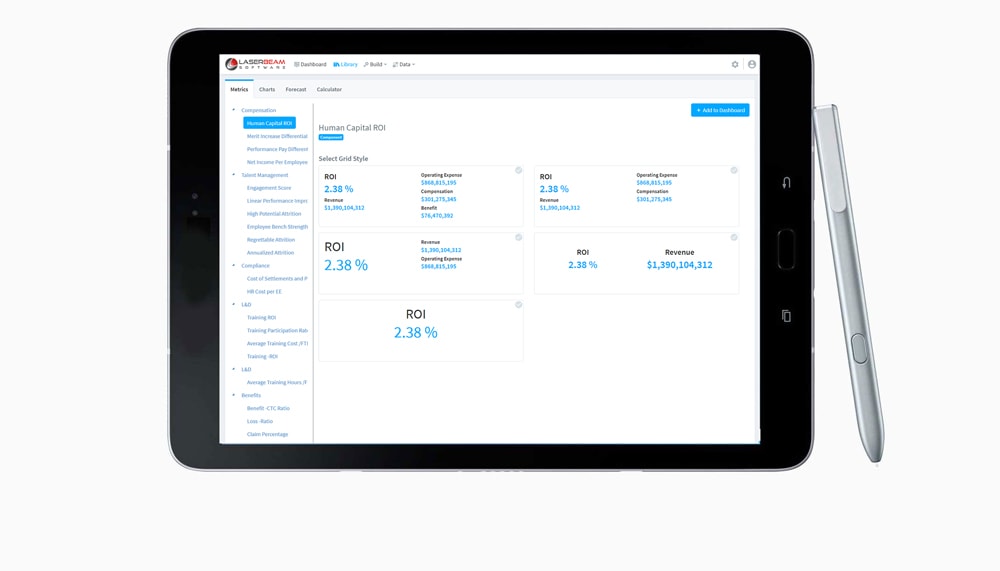
HR teams can now leverage Laserbeam’s 100+ pre-built HR Metrics readily available in the tool and benefits are instant, few metrics are listed below.
| Compensation | Talent Management | Compliance |
| Human Capital ROI Merit Increase Differential Performance Pay Differential Net Income Per Employee | Engagement Score Linear Performance Improvement Rate High Potential Attrition Employee Bench Strength | Cost of Settlements and Penalties HR Cost per EE |
| Learning & Development | Benefits | Payroll |
| Training ROI Training Participation Rate Average Training Cost /FTE | Benefit -CTC Ratio Loss -Ratio Claim Percentage & Processing Time | Absence Rate Annual Payroll Cost Diversity Average Gender Pay Gap Median Gender Pay Gap |
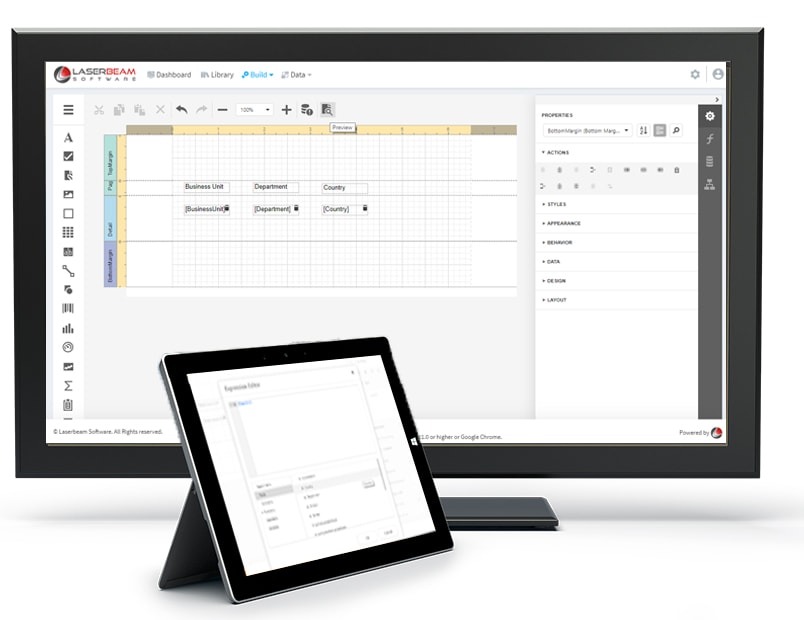
While there are prebuilt reports that can be printed as a .PDF format, businesses constantly wants variation in the way they want to see the numbers and HR teams constantly pull spread sheets and make them look pretty. We have made it easier get a simple easy to build report designer to build your own reports on the fly
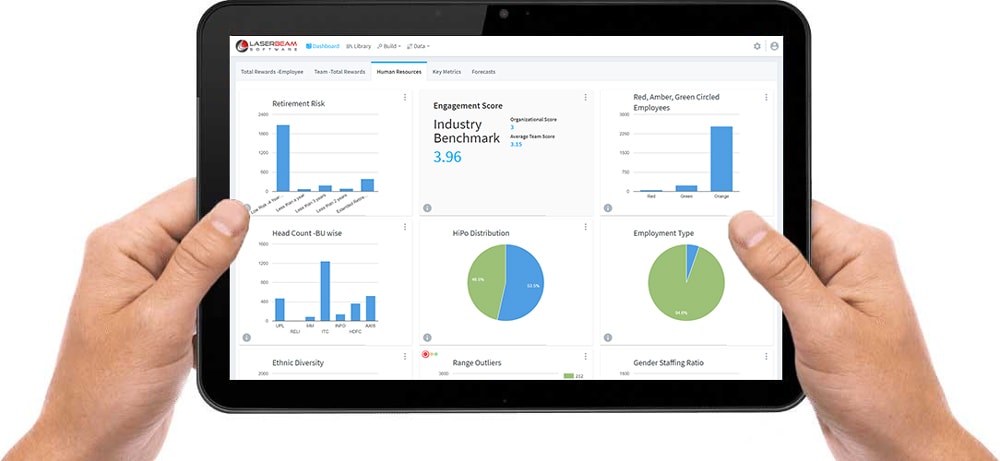
Compass Analytics Dashboard gives the power to present all that you have analyzed in a presentable form of charts and graphs, in a secure manner. The dashboard can be customized with tiles of information configured to the consuming user. Share, Copy to clip board, Export the underlying data, set alerts and receive them based thresholds and much more features that makes sharing and acting on information by the right team on the right data.